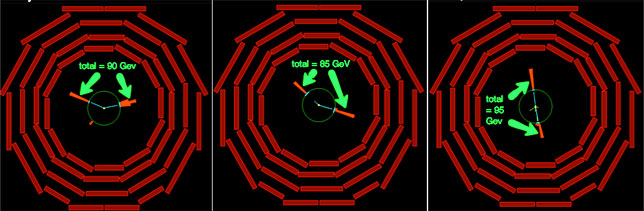
Here are three different dielectron events each with different total energies.
Multiple events can be displayed together according to types. See this screencast showing how to move from single events to histograms.
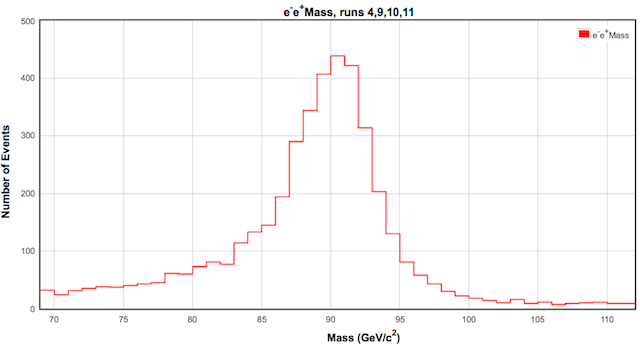
Here's an example of a histogram made from many events like the ones shown above.
What is plotted here is the invariant mass of dielectron events. The bumps like the one you see below emerge as you plot many individual dielectron events.
Try the exercise "Finding the Mass of Particle Parents" (Safari/Firefox - Internet Explorer) to practice associating the invariant mass of individual dimuon events with the histogram.
Try the CMS Data Express activity to practice putting invariant masses into a histogram.
Histograms reveal statistical properties that cannot be considered on an event by event basis. Learn more.
Why are the distribution of events so broad and overlapping? See here to go further.
Be sure to go back to the interpret data reference and fill in your logbook.
Close Window