
|
|
||
|
The detectors record the arrival time of the muons in a raw data file. When analyzing flux study data, students select the dataset and channel(s) to be analyzed. The analysis tools produce a histogram of flux vs. time similar to the one shown below. Students can juxtapose data regarding their independent variable as a function of time to look for correlations. |
||
|
|
||

|
One interesting feature occurs periodically in this scatter plot: the flux diminishes and increases regularly; do you see it? What might cause this? Is the effect real or is it the result of the way this file was plotted? Is there a way that you can tell?
This plot shows flux measurements for detector # 5078
from 7 May to 11 May 2003. The counters were stacked, one on top of the other,
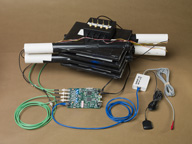
(How the detector works) |
|
 .
.