|
|
|||||||||||||||||||||||||||||||||||||
|
Using the TOF analysis module, one can measure the average time muons take to travel between two counters. Then, we can calculate average speed (v = d/t). We use the following definitions (same as Flux): 1. We set up the detector and collect data with two counters stacked, one on top of the other. 2. The distance between counters, muon's speed, PMT response time, and length of signal cables all affect the time measured between two counters.
We must measure the time of flight of the muon that doesn't include those other experimental effects.
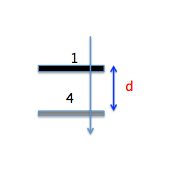
This requires another data run. Collect data with a larger distance between the counters.
How far apart should they be?
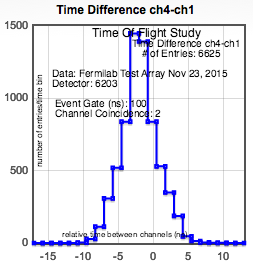
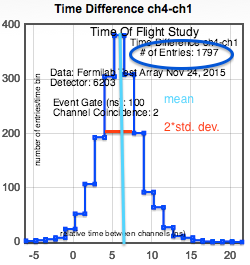
Recommended: d ~ 2m to begin with. Once again, create a histogram, and find the mean time for muon to travel between the counters. 3. Using the results from steps 1 and 2, we can populate the following table:
Why do we use the distribution mean? We now have 2 data points. The x axis represents separation distance, and the y axis represents mean traversal time. We can graph them on paper, use the ScatterPlot tool, or Excel and calculate the slope of the line connecting them. Remember to draw the error bars using mean error. This is 1/(muon speed). Q: What are the units? 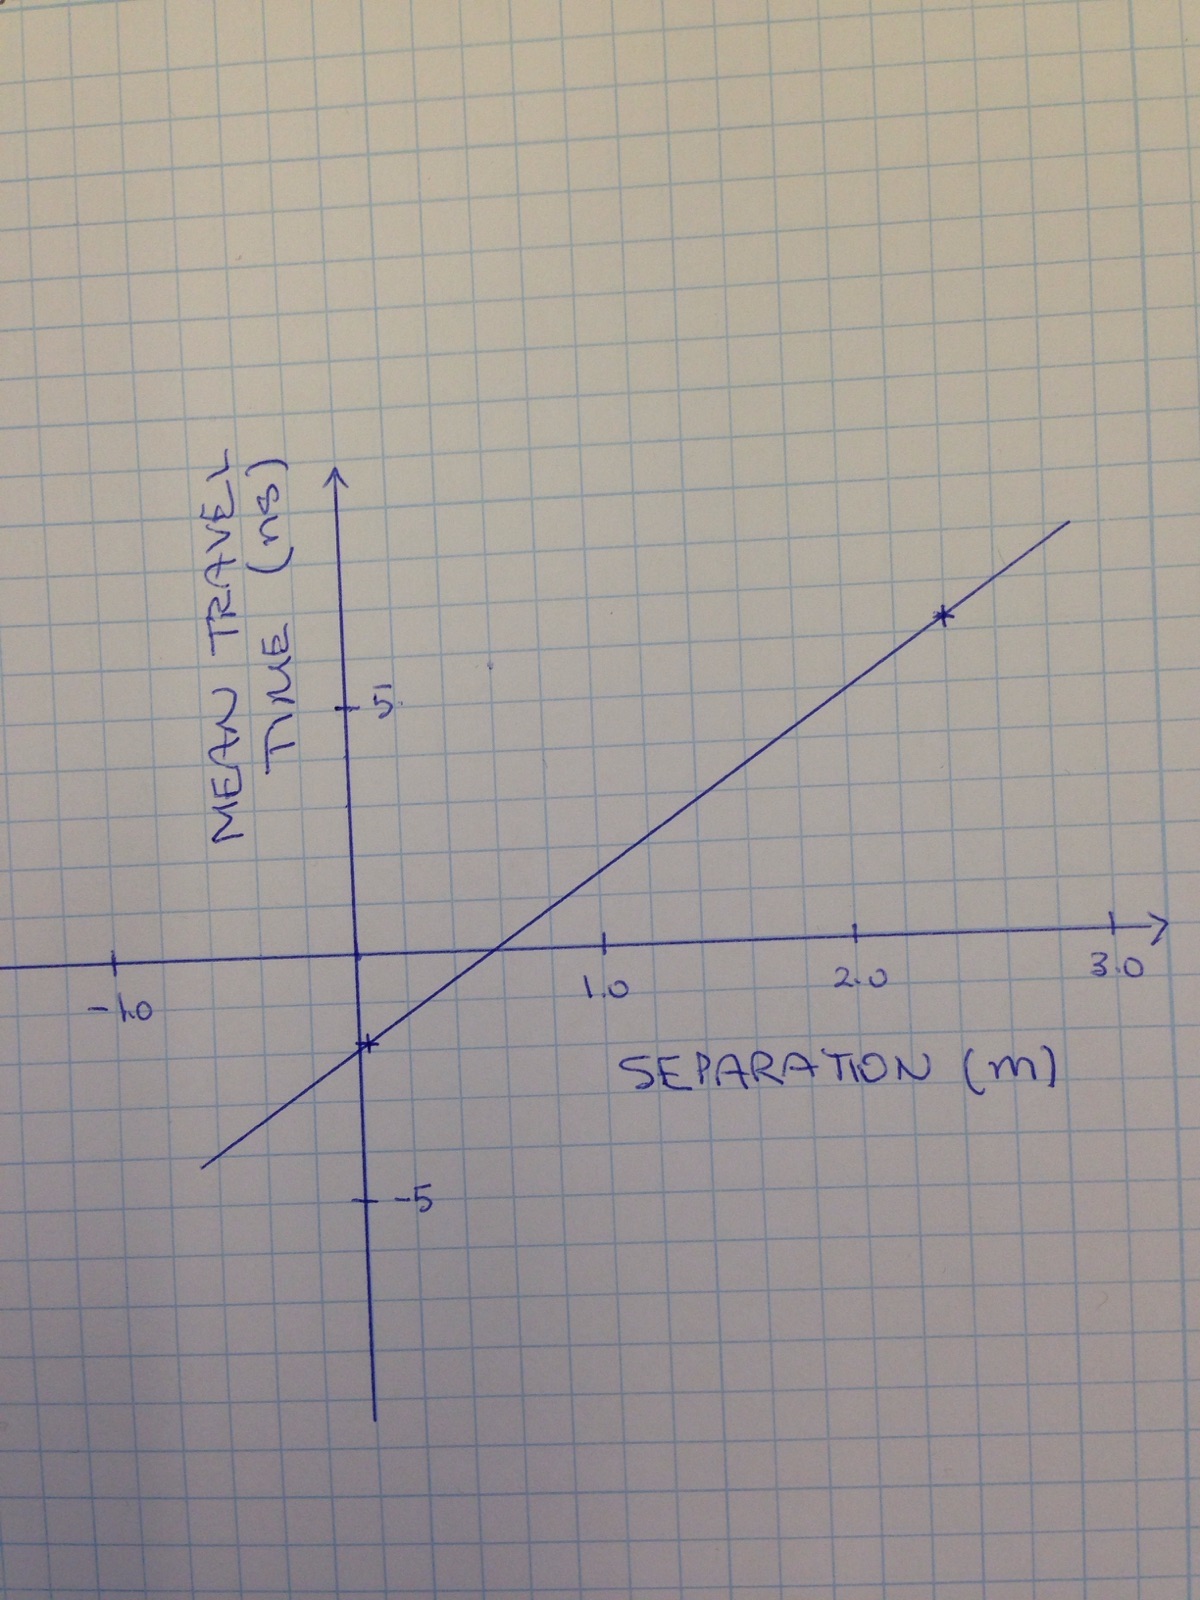 Q: What is the error estimate of muon speed? 4. One can measure muon speed better with more data points representing different separation distances.
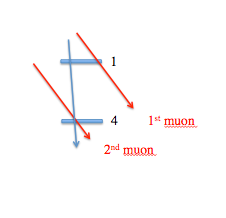
For example, to generate a third data point, swap the two counters. Now, the separation distance d = -2.4m because the muon travels
from counter 4 to counter 1.
We now have 3 data points. Eyeball it, and draw the best fit line. Then, calculate the slope of the line to get a better value for muon speed. Q: Is this speed close to one that is recognizable? 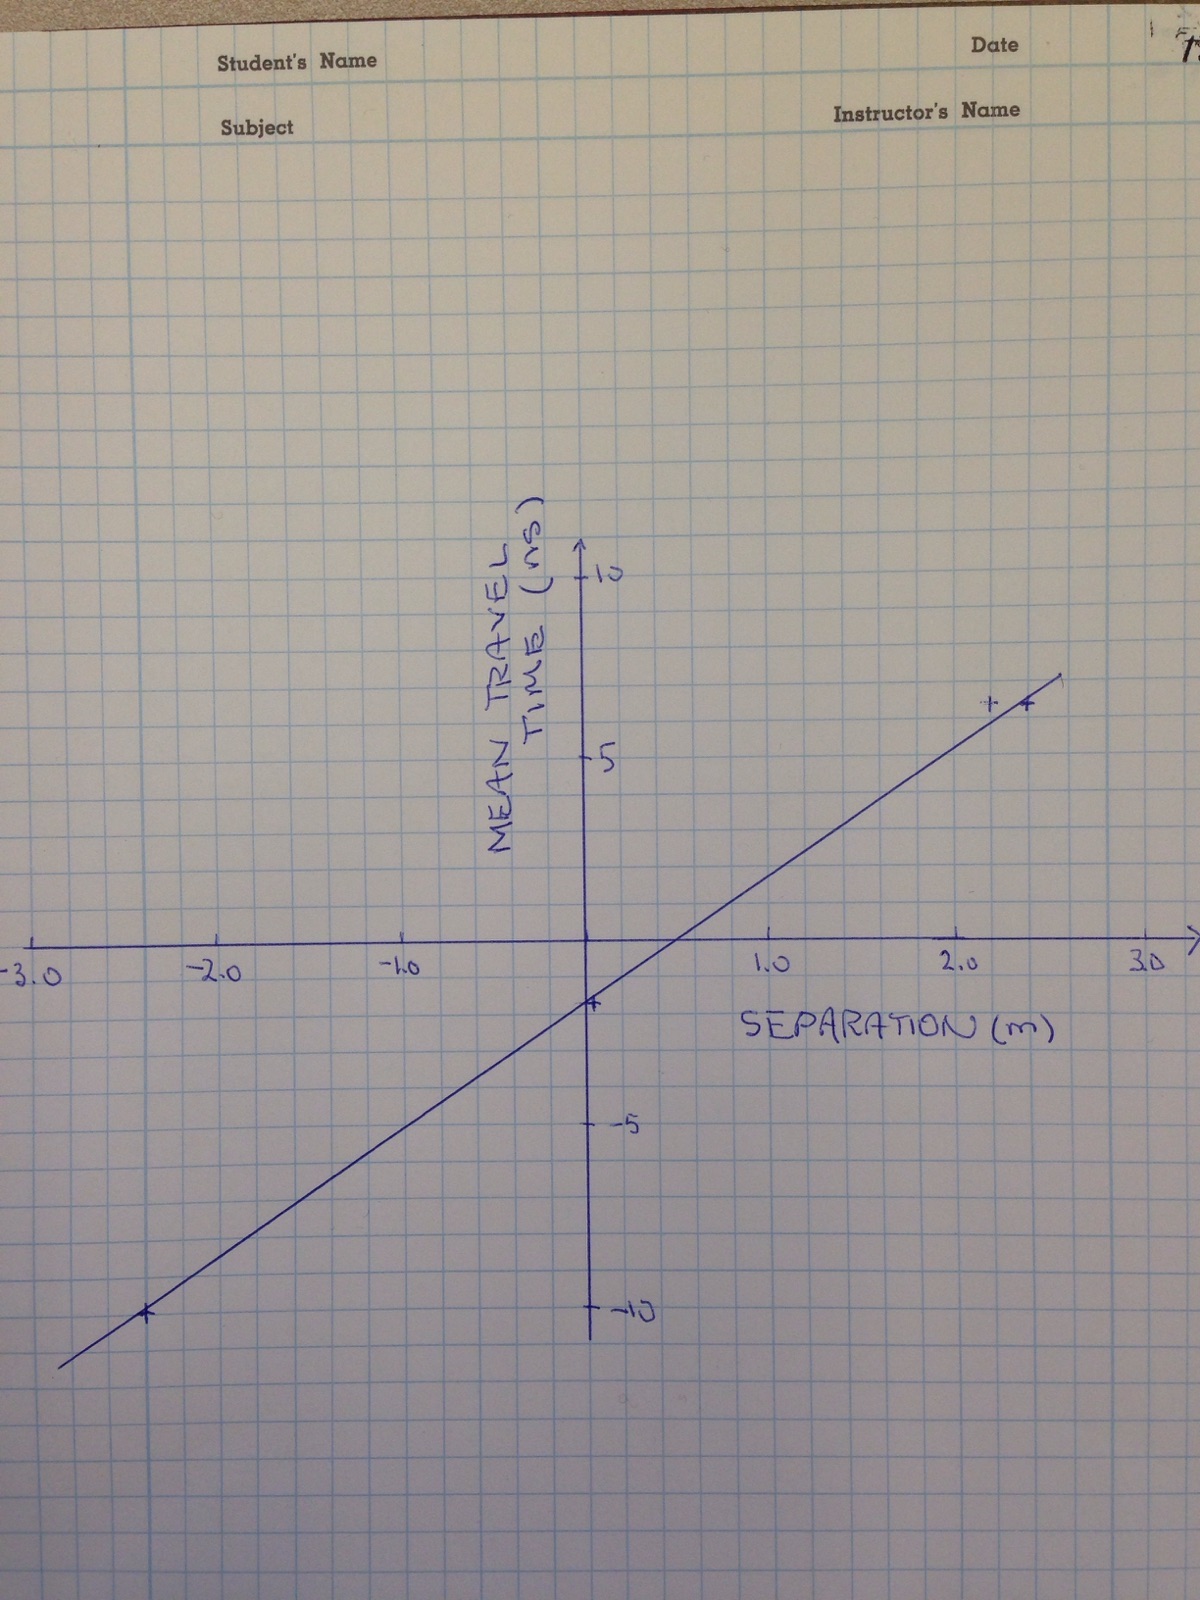
You are now able to measure the average muon speed. You can STOP here, or you can investigate further. |
|||||||||||||||||||||||||||||||||||||
|
|
|||||||||||||||||||||||||||||||||||||
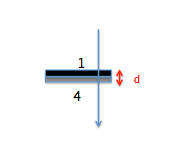
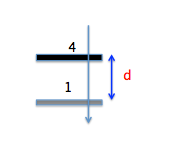
 The top counter is connected to channel 1, and the bottom counter is connected to channel 4.
Measure from the top of counter 1 to the top of counter 4 to estimate the distance the muon travels (d).
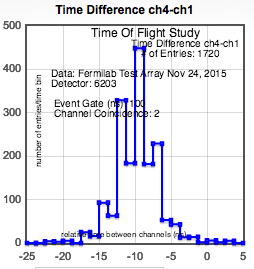
Create a histogram similar to the one below, and find the mean time for the muon to travel between counters.
The top counter is connected to channel 1, and the bottom counter is connected to channel 4.
Measure from the top of counter 1 to the top of counter 4 to estimate the distance the muon travels (d).
Create a histogram similar to the one below, and find the mean time for the muon to travel between counters.