Do Performance Plots Reliably Indicate the Blessability of Data?
07/23/2014
Abstract
The purpose is to determine whether performace plots are a reliable indicator of whether or not data can be blessed. I will attempt to accomplish this by comparing performance plots and blessing plots of various data sets, in particular searching for any patterns between the appearance of the plots and whether the data was blessed or not-blessed.
Introduction
This is a very tentative claim! I claim that the performance plot should be a good indicator of whether a given data set can be blessed.
Procedures
I obtained blessing plots and performance studies for a variety of data sets and compared them side-by-side.
Results
The performance plots for "BadBless" and Riyadh are qualitatively similar, showing a (large?) difference between the peak times over threshold for two of the channels, yet the BadBless data is not-blessed, and the Riyadh data is blessed. Â Likewise, the performance plots for both trials of GroupA are very similar, yet one is blessed and the other is not-blessed.
When we consider the blessing curves, however, we observe great differences. Â Channnel 4 of the BadBless data varies wildly while the other channels perform steadily; and both channels of the Riyadh data perform steadily. Â The BadBless data is thus not-blessed while the Riyadh data is blessed.
The GroupA blessing plots seem nearly identical, but the total number of counts is so low that one of the trials remains not-blessed. Â (I am not able to tell, just by observing the blessing plots, which was blessed and which was not, however.)
Only the Bellevue plots seem consistent to me: Â the performance curves for all channels are nearly superimposed, forming a neat, single-peak curve; Â and the blessing curves show that the counters performed steadily. Â The total number of counts is large.
Figures
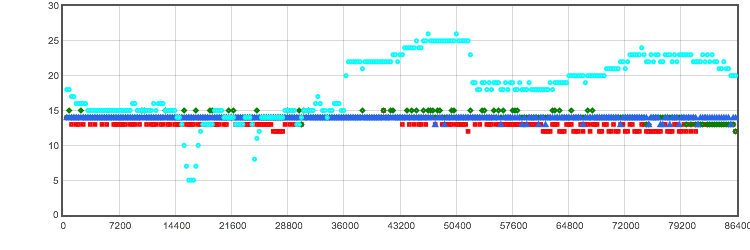
Figure 1. Blessing Plot for BadBless Data (not-blessed)
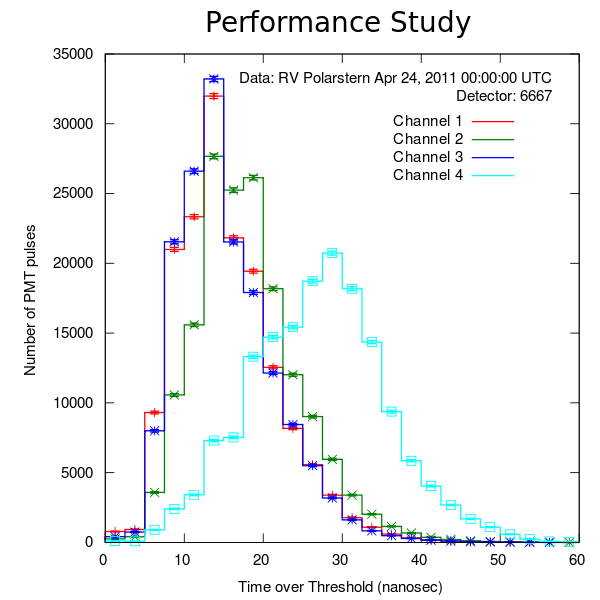
Figure 2. Performance Plot for BadBless Data (not-blessed)
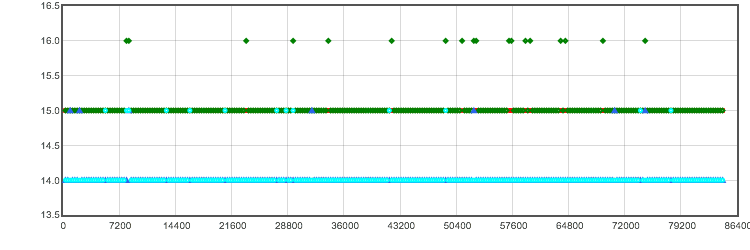
Figure 3. Blessing Plot for Bellevue Data (blessed)
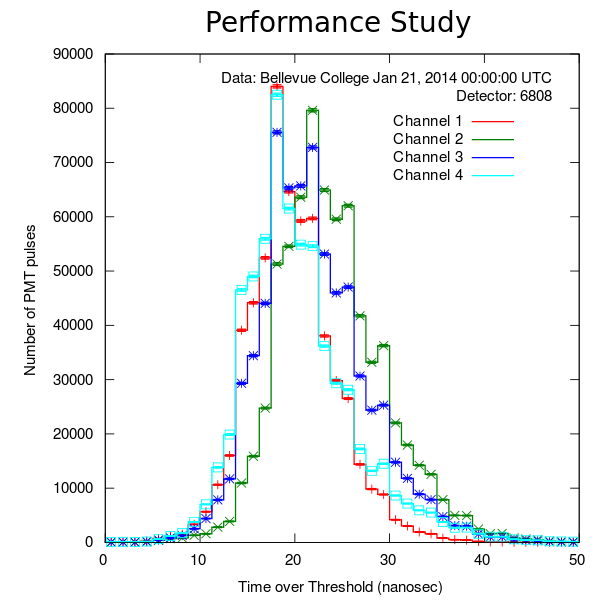
Figure 4. Performance Plot for Bellevue Data (blessed)

Figure 5. Blessing Plot for GroupA Data (blessed)
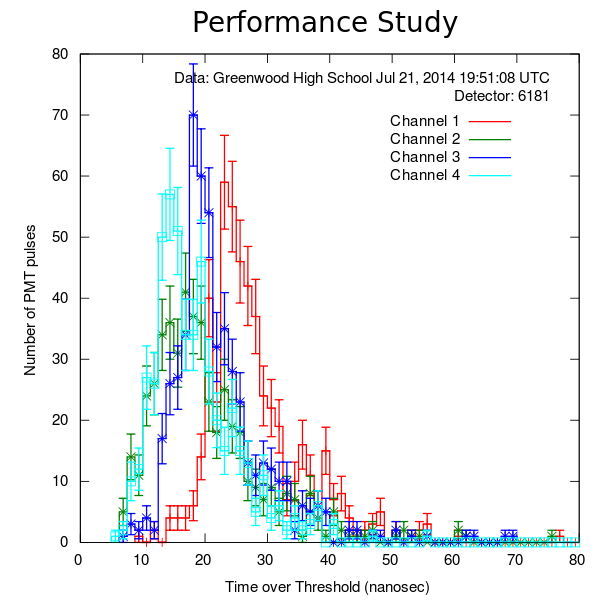
Figure 6. Performance Plot for GroupA Data (blessed)
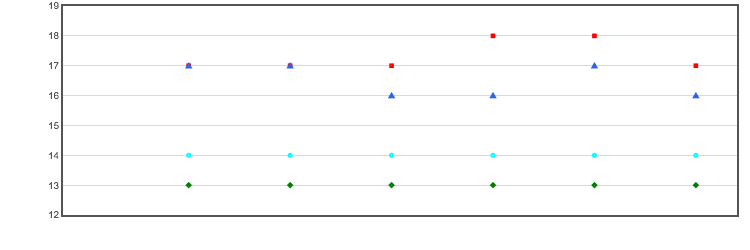
Figure 7. Blessing Plot for Group A Data 2 (not-blessed)
Figure 8. Performance Plot for Group A Data 2 (not-blessed)
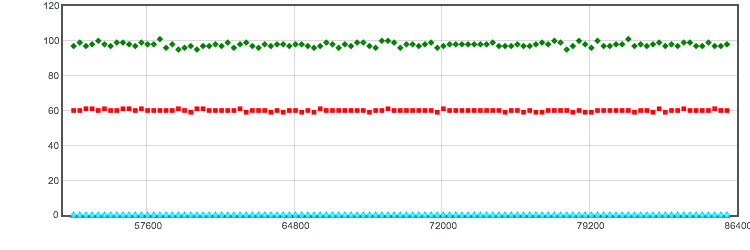
Figure 9. Blessing Plot for Riyadh (blessed)
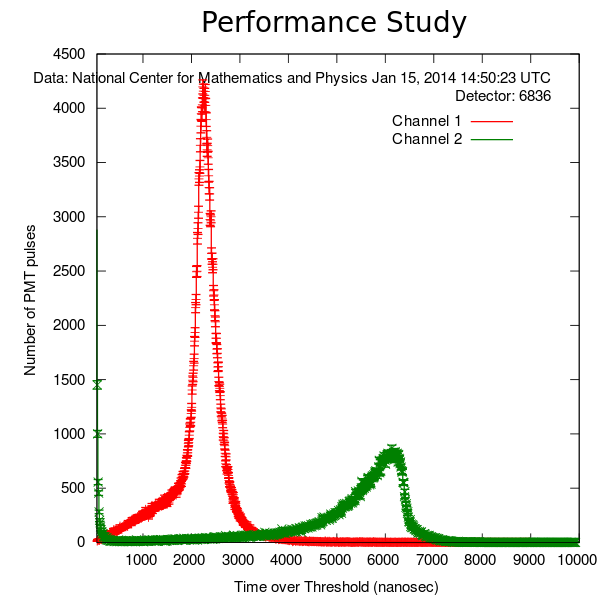
Figure 10. Performance Plot for Riyadh (blessed)
Discussion and Conclusions
I have two conclusions:
1) Â The performance plot is not a reliable indicator of the blessability of data.
2) Â Blessable data has two important qualities: Â large total number of counts, and stable count rates.
Bibliography