How Altitude Affects Flux of Muons
09/20/2017
Abstract
The purpose of this experiment was to determine if there is a relationship between altitude and the number of cosmic ray muons. Our hypothesis was; If we research the relationship between altitude and the number of cosmic ray muons, then we will find that the relationship between altitude and cosmic ray muon flux is directly proportional. To find out if our hypothesis was correct or incorrect, we used the Cosmic Ray e-Lab website and the data on it to find multiple different sets of data charting cosmic ray flux at different altitudes. We then used the data we collected to analyze if there was a relationship. After researching and analyzing, we concluded that our hypothesis was correct. We concluded that altitude and cosmic ray flux are directly proportional. The relationship is that as the flux increases, so does the altitude, and vice versa.
Introduction
Cosmic rays are particles beams that have very high amounts of energy, and come from very far away in the universe. When the cosmic rays enter the Earth’s atmosphere, they decay into something called Muons. Muons are indirectly created as decay products from when cosmic rays collide with particles of the Earth’s atmosphere. We are interested in the relationship between altitude and the flux of Cosmic Ray Muons. The question we are trying to solve is; What is the relationship between the altitude of a Cosmic Ray Muon Detector and the number of Cosmic Ray Muons detected?
Procedures
We found and compared flux studies on data sets from January 18, 2017 to February 18, 2017. We are comparing six cities all of varying altitudes throughout the United States. The first city is Honolulu, Hawaii with an altitude of 19 feet. Bellevue, Illinois has an altitude of 85 feet while Nashville, Tennessee has an altitude of 597 feet. Next is Buffalo, New York with an altitude of 600 feet. Basehor, Kansas is after that at 981 feet. Finally Grace, Idaho is our highest studied city with an altitude of 5,535 feet. We recorded the data from the flux studies for each of these cities and compared them to see if there is any correlation between altitude, and to the number of muons detected.
Results
Throughout the course of this experiment we dug through many plots, looking for a pattern in the flux of muons from different altitudes. We then chose 6 different plots that we thought best represented these patterns. Our data comes from varying altitudes across the United States.
Plot 1) The first school we tested was from Grace, Idaho. The elevation of Grace is around 5,535 ft. The flux study in this plot displayed a time (hours) between a 24 hour period. The flux stayed pretty consistent in a range of around 10,000.
Plot 2) The second school we tested was from Buffalo, New York. The elevation of Buffalo was immensely lower than grace; 600 ft. The flux study in this plot displayed a time (hours) between a 15 hour period. The flux stayed pretty consistent in the 4,500 range.
Plot 3) The third school we tested was from Honolulu, Hawaii. Honolulu’s elevation was our lowest by far standing at around 19.03 ft. The flux study in this plot displayed a time (hours) between a 7 hour period. The flux ranged from around 200-300.
Plot 4) The fourth school was from Nashville, Tennessee. Nashville’s elevation was around 597 ft. This flux study was taken over a 24 hour period and the results were ranging from 7-30.
Plot 5) The fifth school was from Bellevue, Illinois. Bellevue’s elevation was around 85 ft and it’s flux study stayed pretty consistent around the 5,000 range which was taken over a 24 hour time period.
Plot 6) The sixth and final school was from Basehor, Kansas. Basehor elevation was around 981 ft and it’s flux study was taken over a 24 hour time period and stayed consistent around the 5,000 range.
Figures
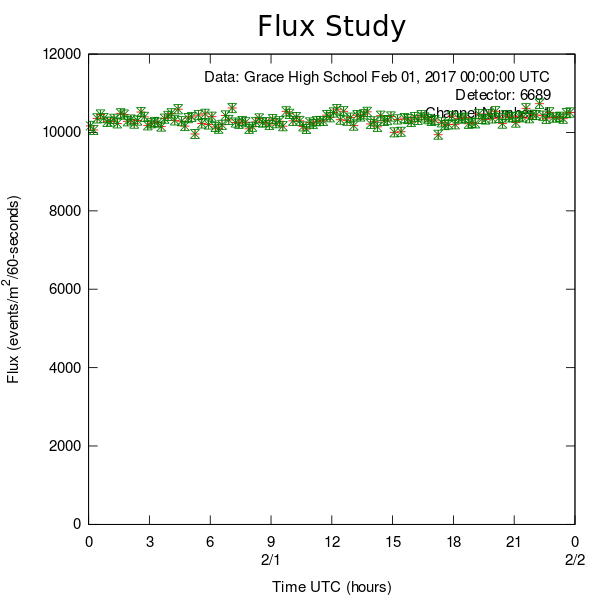
Figure 1. Altitude: 5,535'
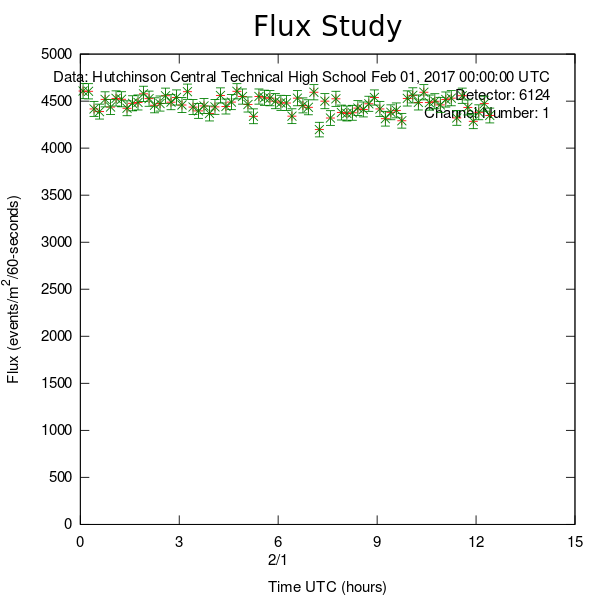
Figure 2. Altitude: 600'
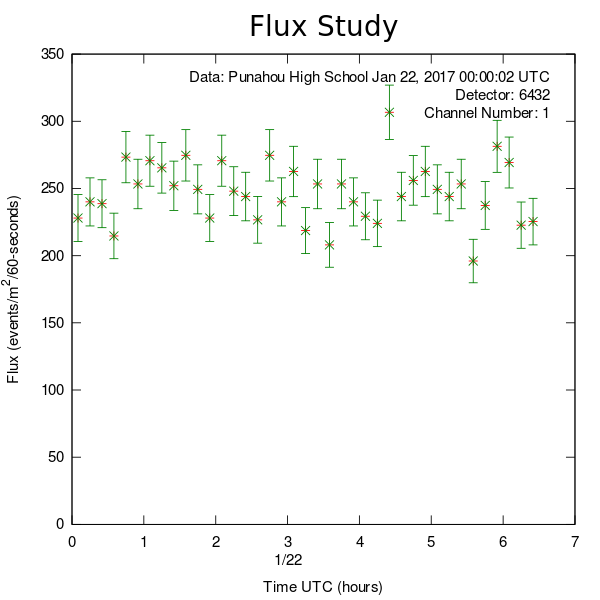
Figure 3. Altitude: 19.03'

Figure 4. Altitude: 981'

Figure 5. Altitude: 85'
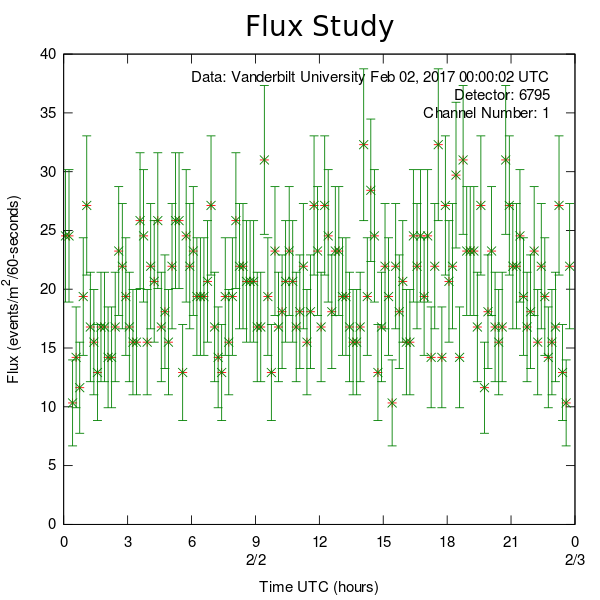
Figure 6. Altitude: 597'

Discussion and Conclusions
After Comparing the data from the flux studies for each of the cities we tested, we found that there is in fact a correlation between the altitude, and the number of muons detected. We can be certain of this because our lower altitude cities have a lower amount of muons detected while our highest altitude cities have way more detected muons. Honolulu was our lowest altitude city tested and the flux range was around 200-300. Grace Idaho, our highest altitude city, had a flux range of 5,335. All 4 cities between these gradually followed the same pattern of while altitude increases, so does the flux range.
Bibliography