Constructing a Muon Baseline
Grace High School 2015-16 School Year
06/07/2016
Abstract
When I first started attending QuarkNet workshops, Bob Peterson mentioned that it would be great for someone to count quasi-continuously throughout the year in order to create a baseline from which to be able to easily notice variations in muon flux. ĀThis year I decided to take a crack at creating such a baseline. ĀWhile it does not include a continuous graph, it does contain data from between 70 and 80 percent of the days during the 2015-2016 school year. ĀThe muon flux was fairly constant for the majority of the year with a couple changes that are explainable.
Introduction
High energy cosmic rays are constantly bombarding the upper atmosphere producing, amongst other things, relativistic muons. ĀSome of these muons can be detected at ground level. ĀThe flux of these particles can be affected by a variety of conditions including changes in atmospheric pressure, elevation and electromagnetic fields. ĀIn order to determine "real" changes in flux and not just statistical variability, a good muon baseline is useful. ĀThis is the purpose of this paper.
Procedures
I simply had my counter operating as much as possible, uploading data and creating a new file every Monday. Due to forgetfulness, power outages and lack of satellite communication, I was only able to get data on between 70 to 80% of the days in the school year. Ā
Results
The following graphs show muon flux for ~60 day increments during the 2015-16 school year. ĀAs can be seen, there are many gaps in the data during which time the counter was not operational. ĀEach data point is a 1 hour average rate. Ā
Figures


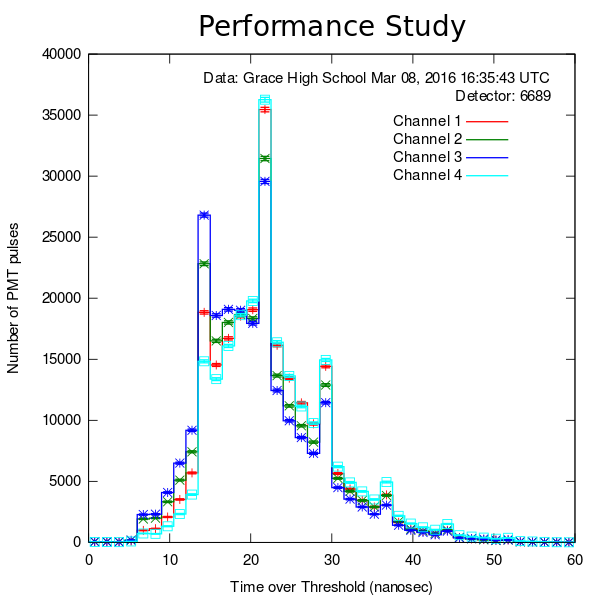
Figure 5. A typical performance study for the 2015-16 school year.

Discussion and Conclusions
Apart from statistical variation, the only drastic changes in muon flux occur near January 19th, and April 11th. ĀThe reason for the April 11th change is obvious. ĀI had been running at 4-fold coincidence but the International Muon Week called for 3-fold coincidence counting, hence the uptick in counts. ĀHowever, the January 19th ~17% decrease in counts is unexplainable. ĀThe count rate on each individual detector was the same as those measured on the 13th of January, but the trigger rate changed from 10 Hz to about 8.3 Hz. ĀAt some point during the year, I remember fine tuning the potentiometers to more closely match the voltages found during plateuing. ĀHowever, this would presumably have changed both the trigger rate and individual counter rates. ĀThe fact that the count rate went down and stayed down until the April increase due to coincidence change indicates that it probably wasn't a natural phenomenon unless this phenomenon has a characteristic timescale longer than a few months. ĀI plan on doing this again this coming school year, paying more attention to the specifics as well as maximizing the time the detector is collecting.
Bibliography