Muon Flux Rate v. Plate Separation Distance
06/15/2017
Abstract
We are attempting to establish a mathematical relationship between muon flux rate and separation distance of the scintillator plates.
Introduction
The count of muons detected by the four plates of the cosmic ray detector should decrease as the distance between the plates is increased. ĀAssuming that flux density of muon incidence on the surface of the earth at a given altitude is uniform, the detection of that muon activity should increase as we increase the solid angle surface area of our sphere of measurement. ĀAs the distance between the scintillator plates is decreased, the solid angle of measurement is increased by the square of that distance. ĀWhat is the relationship between muon flux rate and plate separation distance?
Procedures
The cosmic ray detector was arranged in a stacked configuration of pairs of scintillators. ĀThe DAQ (see Figure 1) was set to measure counts only when all four plates registered a muon. ĀEach count was taken over a fifteen minute period during the afternoon. ĀOnly one count was recorded at each level. ĀThe first count was taken at the maximum pair separation (see Figure 2) to insure that the apparent minimum value would be sufficient to support the rest of the data. ĀAfter recording the initial count at the maximum separation, the plates were moved closer (see Figure 3) and a new count was taken. ĀA total of six different counts were taken, one at each separation distance. ĀAdditional data was taken the following day. ĀThree separate counts were taken at each distance. ĀThe average rate per minute was calculated, tabulated and plotted.
Ā
The separation distance was measured in inches and converted to centimeters (2.54 cm/in). ĀThe surface area of the plates was also measured in inches and converted to centimeters using the same unit conversion.
Ā
Ā
The count rates were plotted versus separation distance of the plates, and a curve was fit to the data.
Results
The graph of the average rate and quadratic fit (1/d) is shown below (Figure 4). ĀFigure 4 is a scatterplot of muon count rates vs. plate separation for the six locations. ĀThe shape of the curve is consistent with the relationship Counts proportional 1/d2Ā. The inversely proportional relationship with the square of the distance is clear and confirmed by the correlation coefficient of the quadratic regression.
Figures
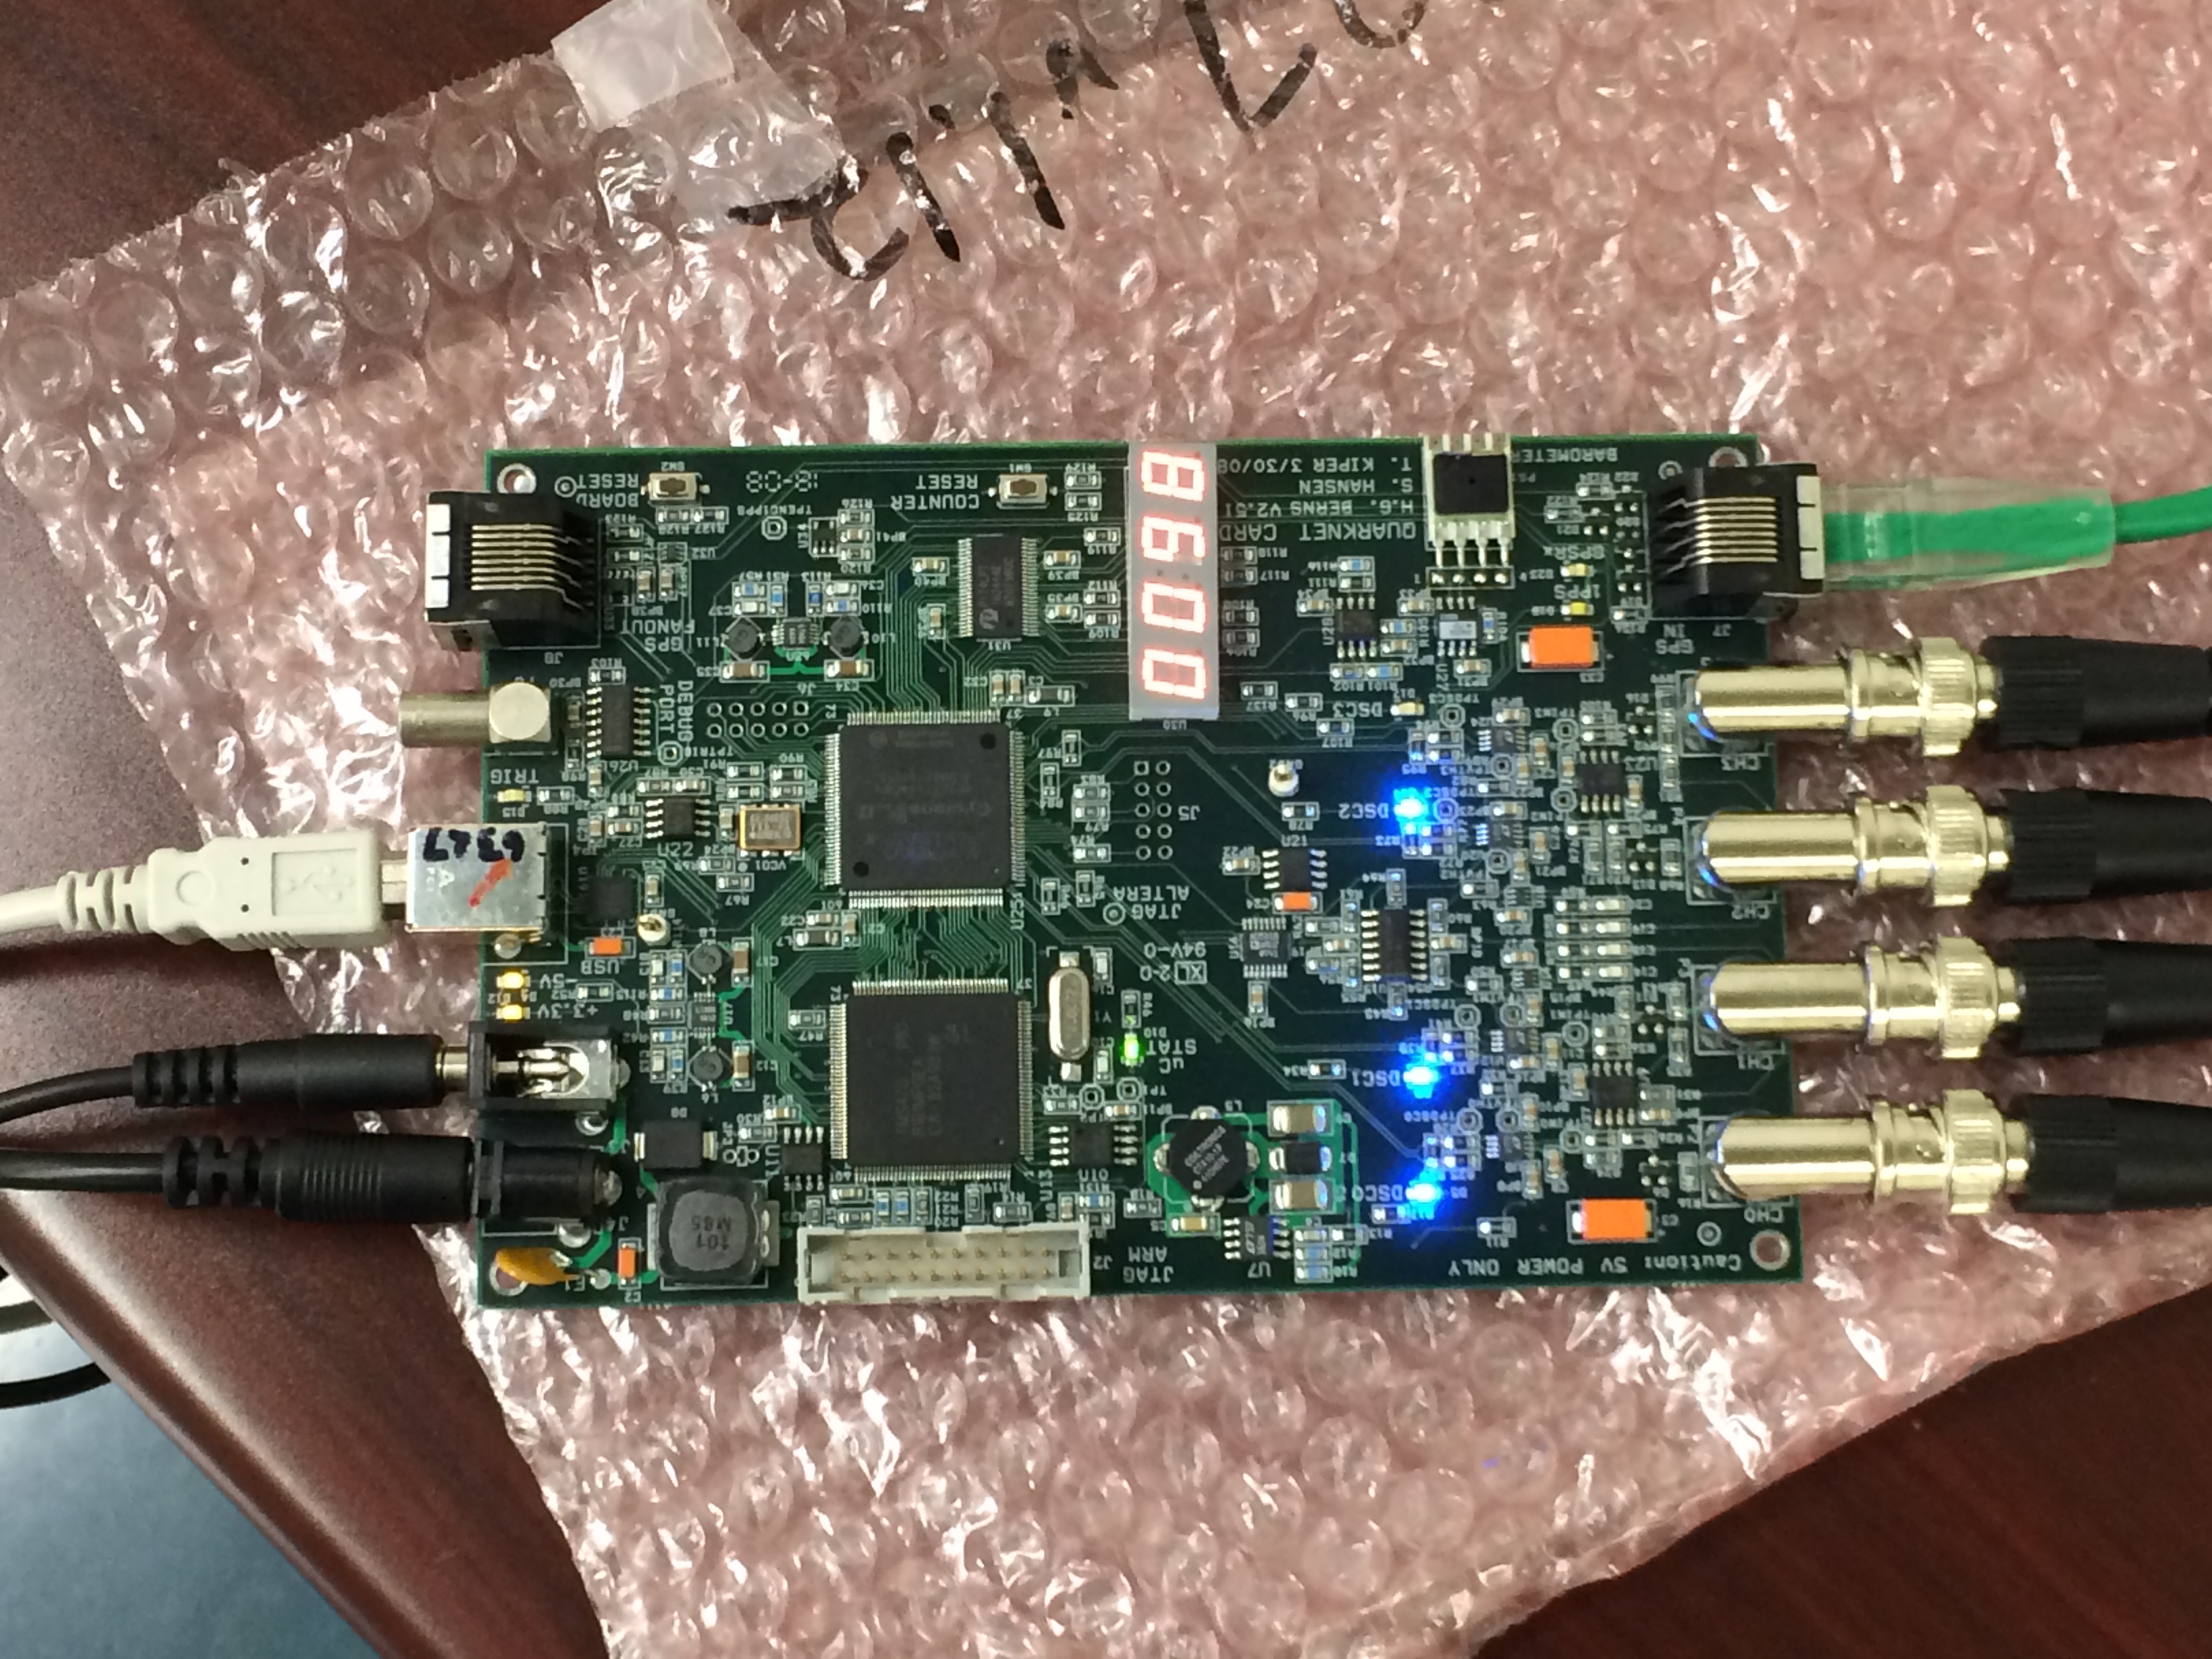
Figure 1. Image of DAQ used for counting muon activity.
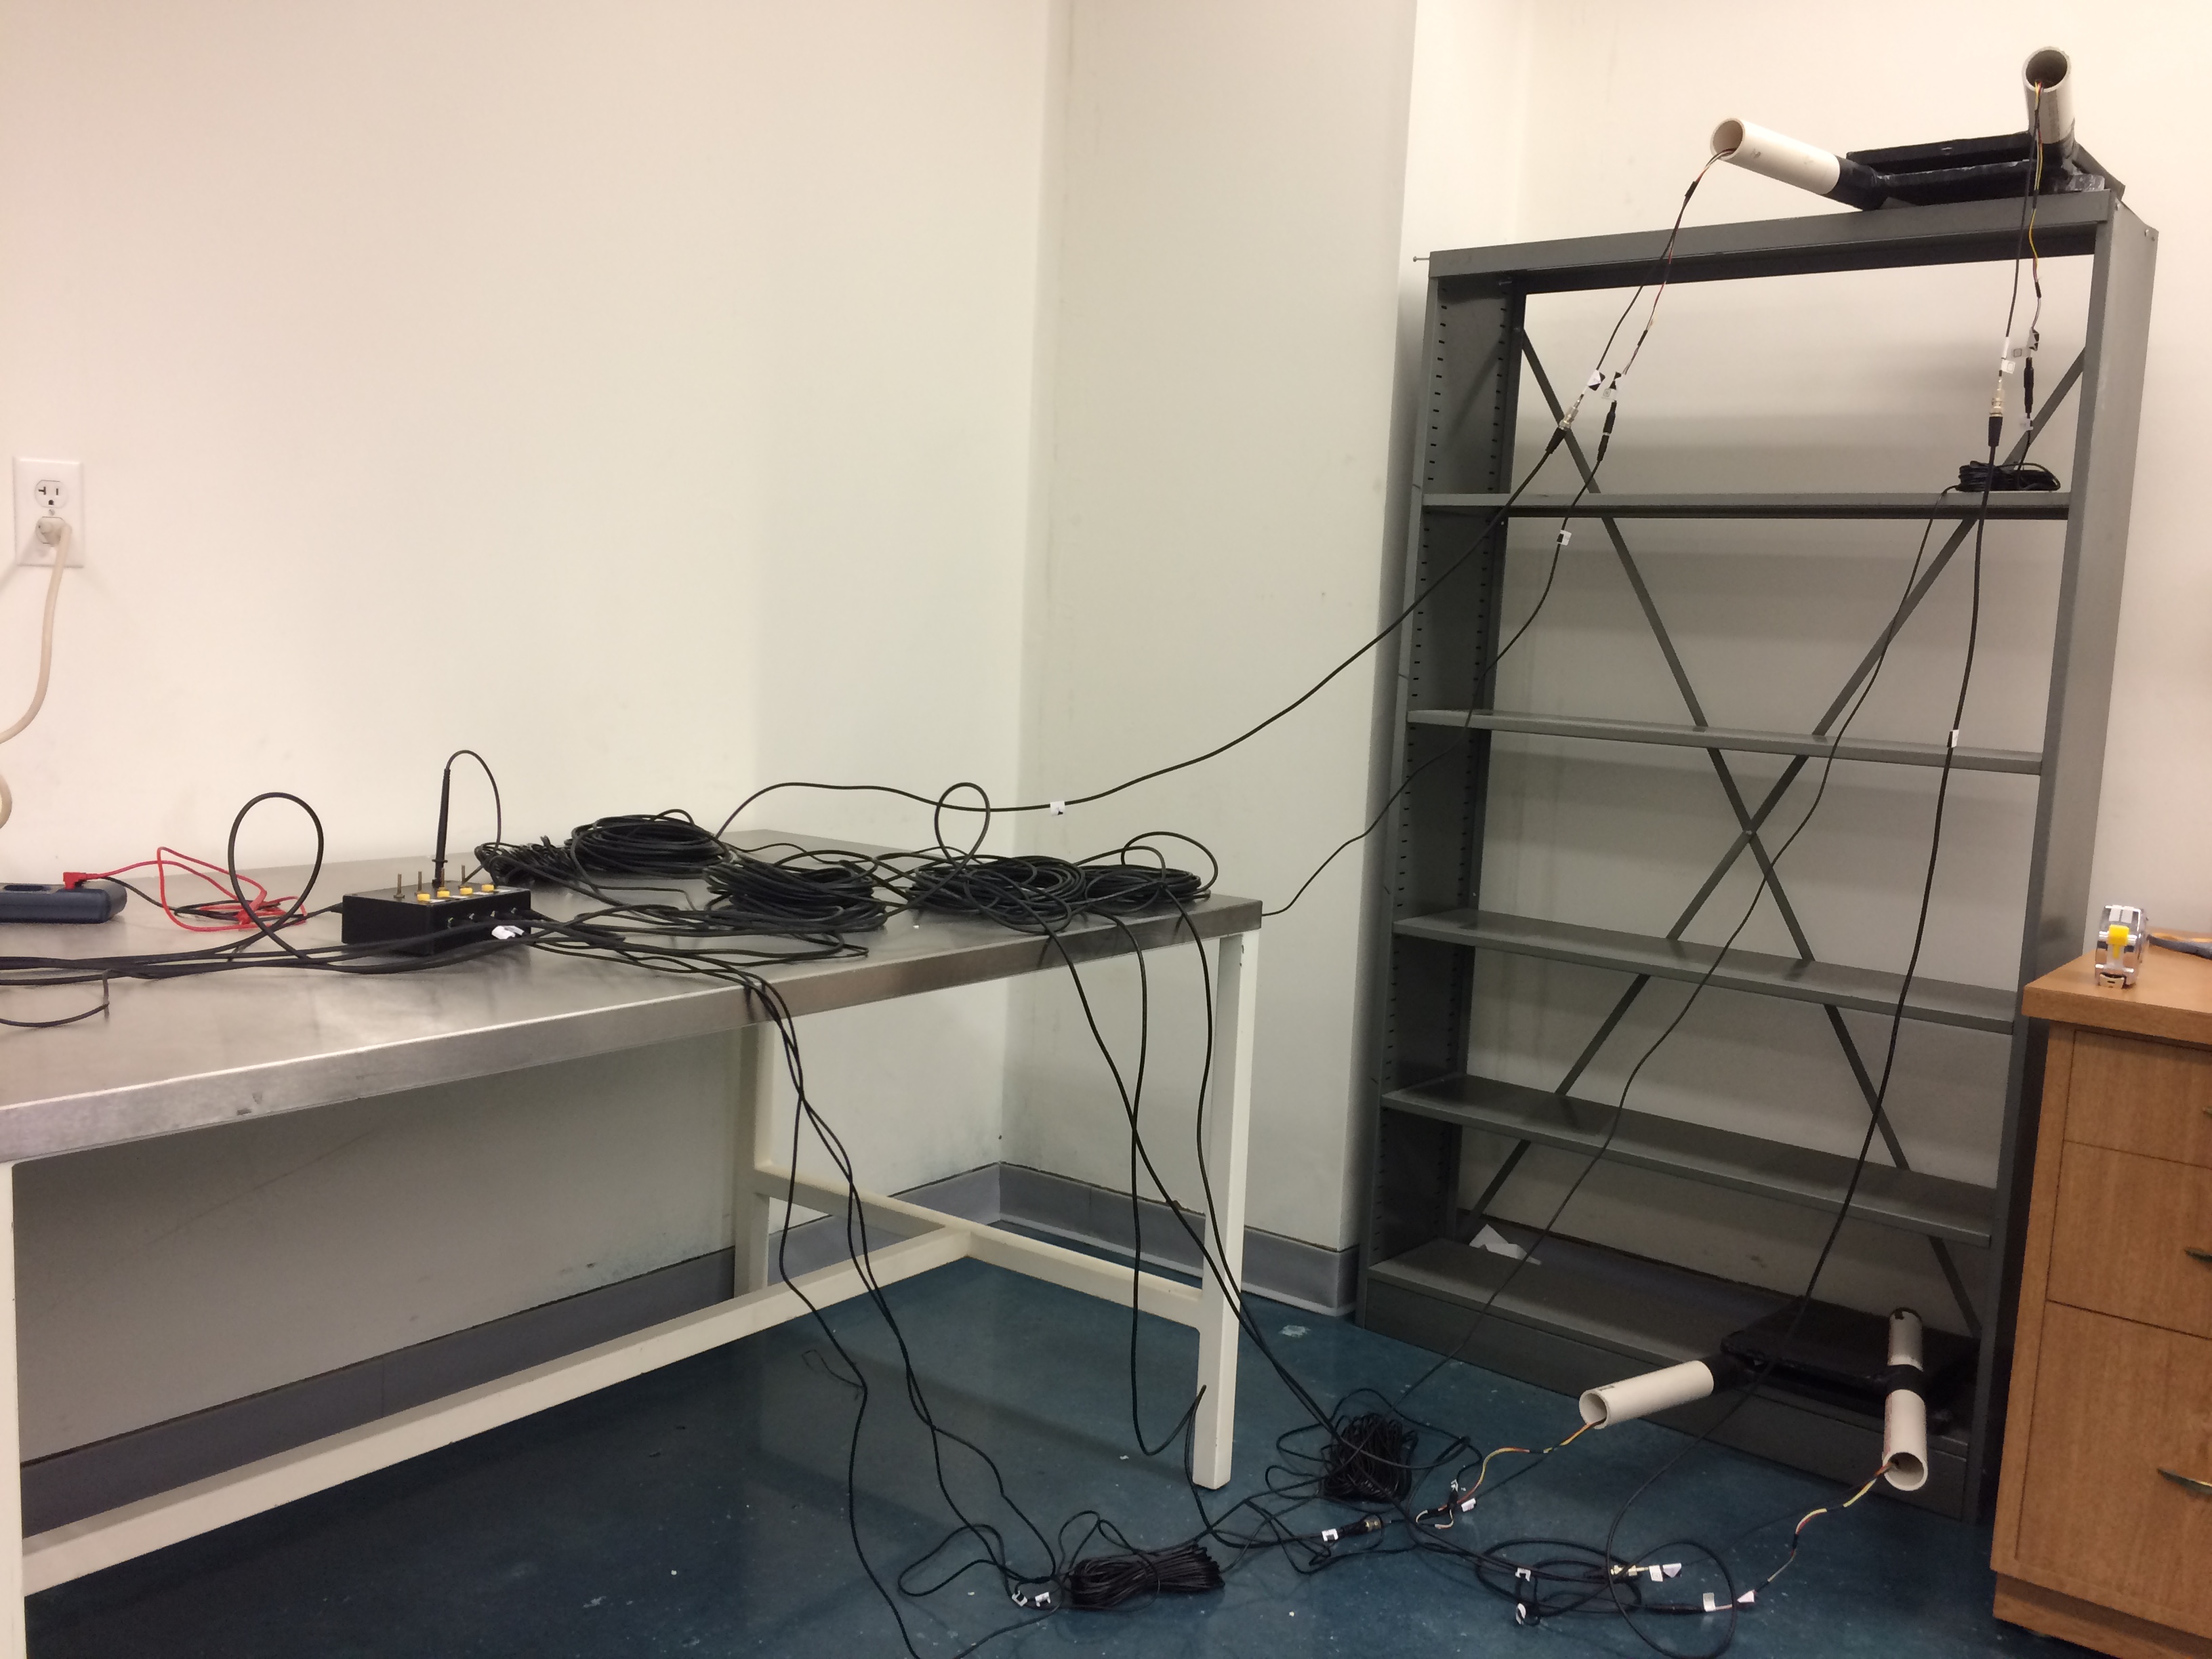
Figure 2. Image of Scintillator Plates at maximum distance.
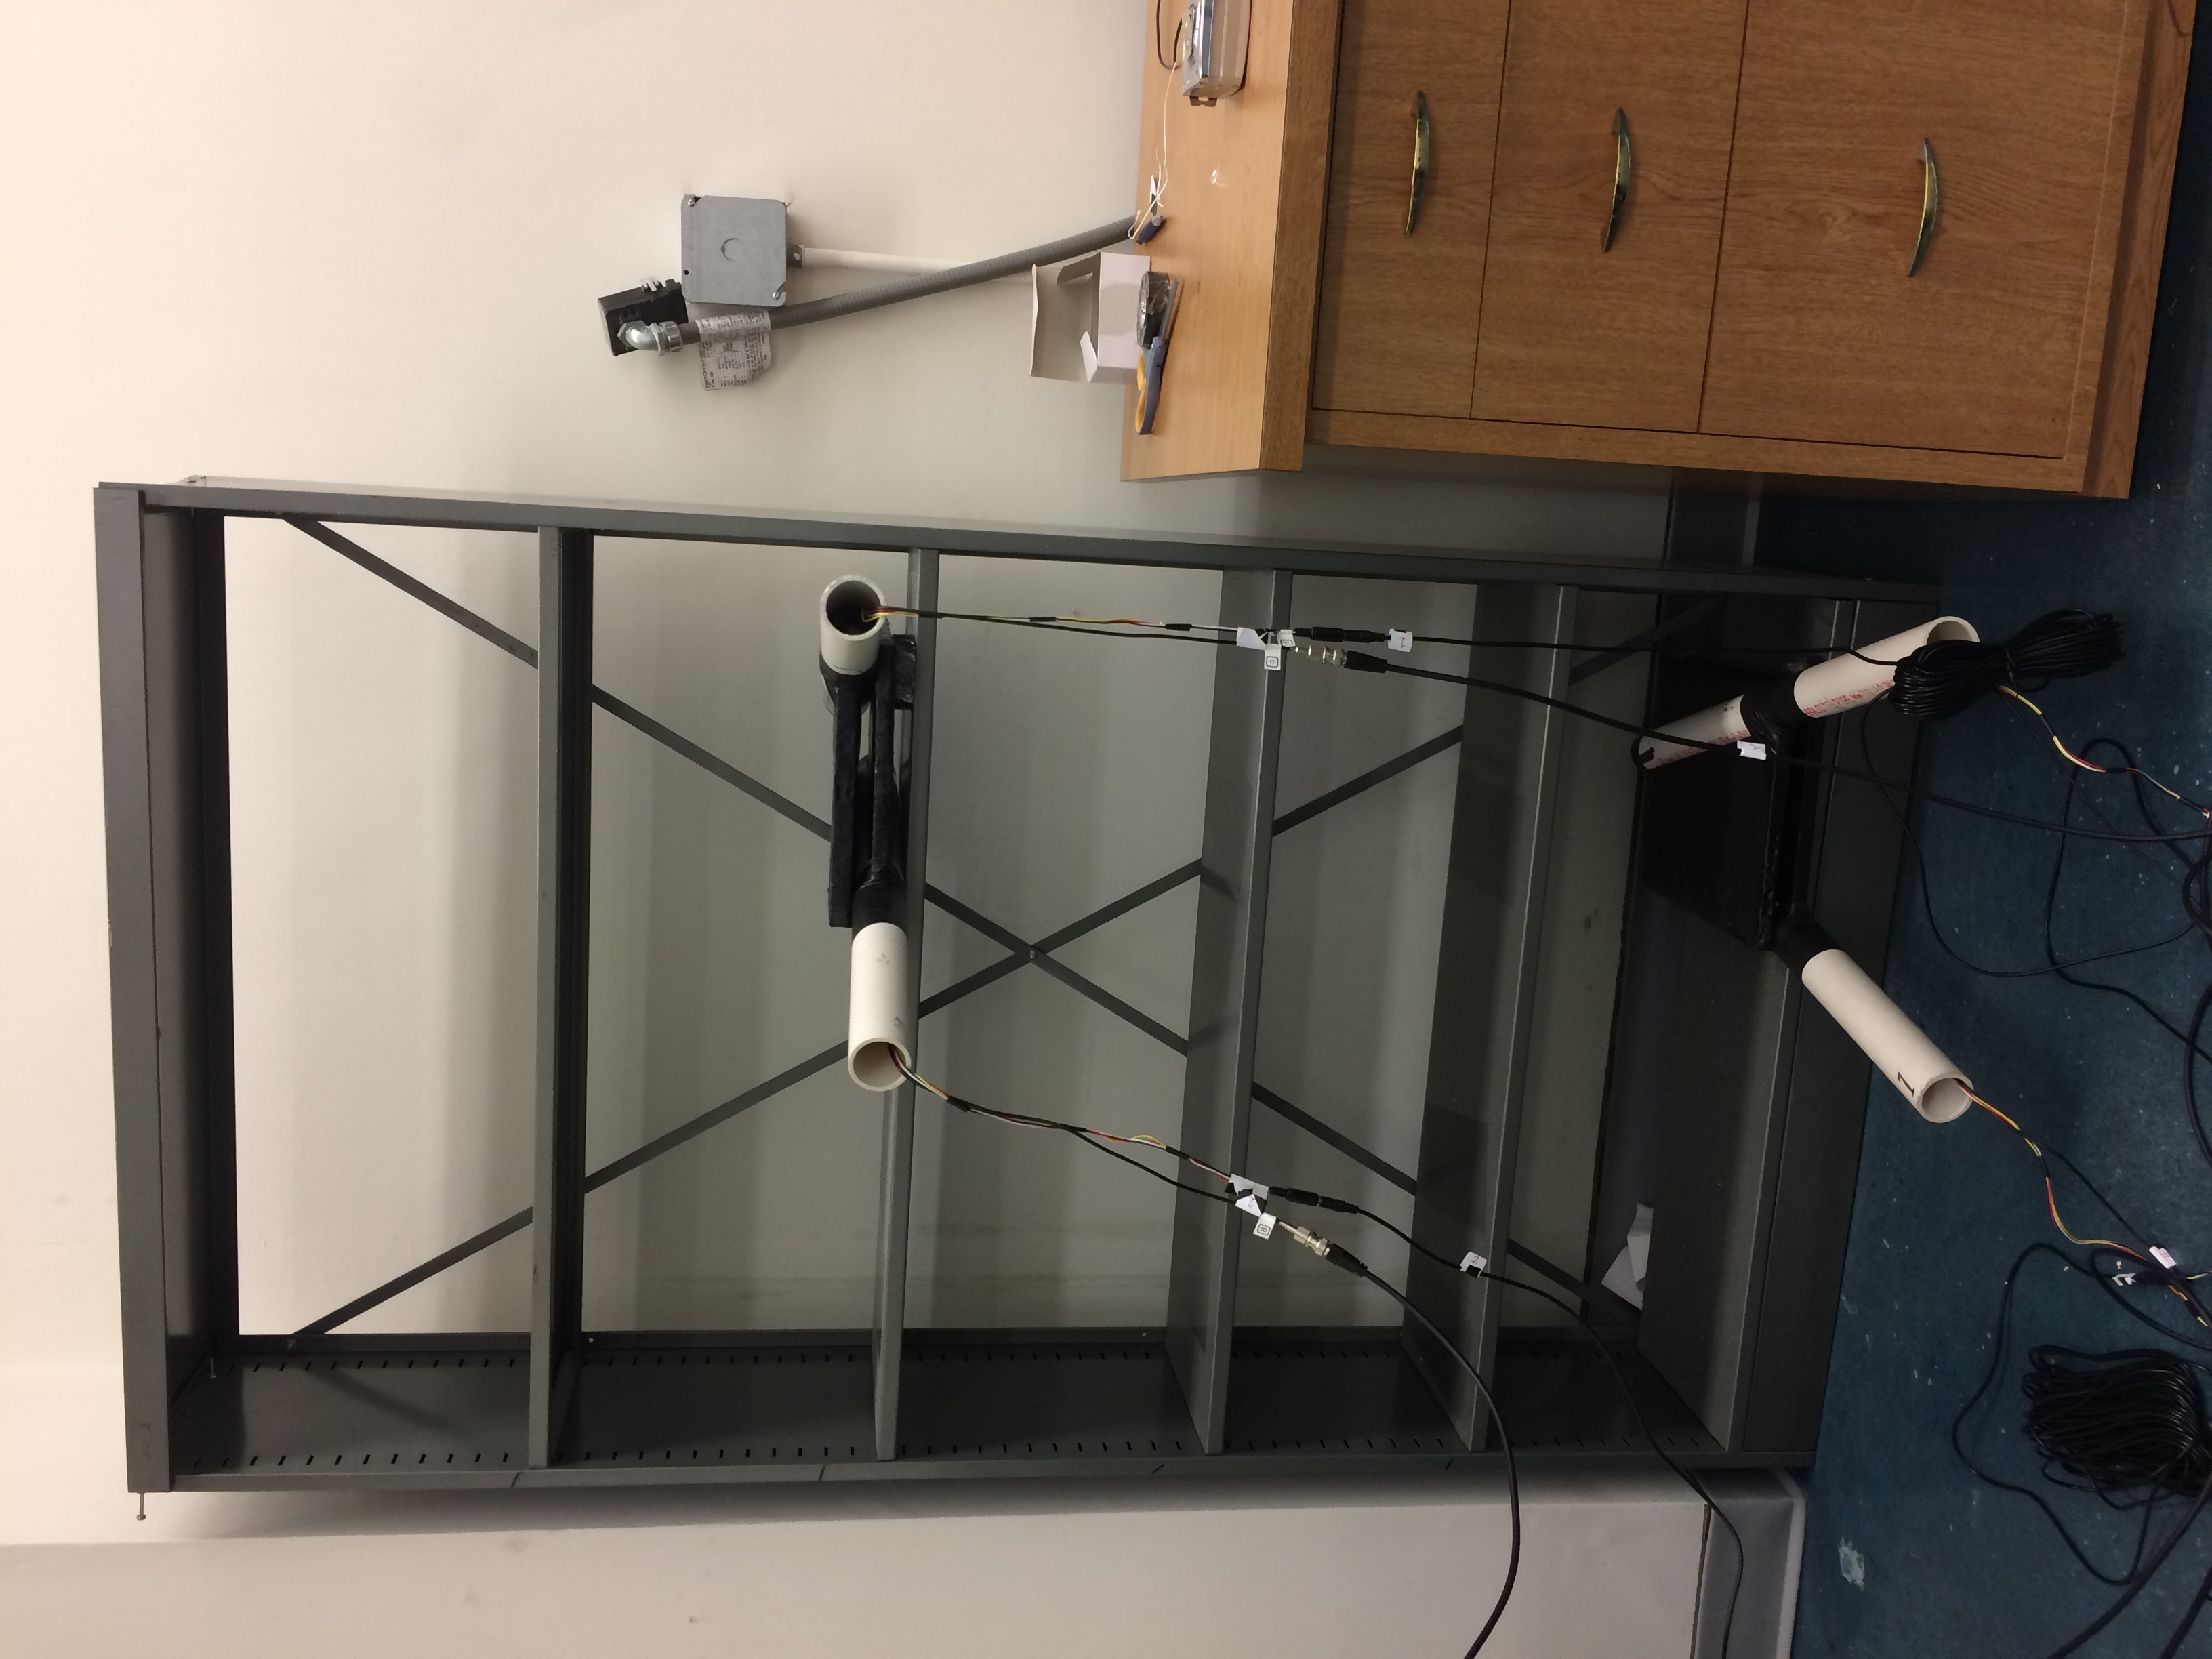
Figure 3. Image of Scintillator Plates at a distance.
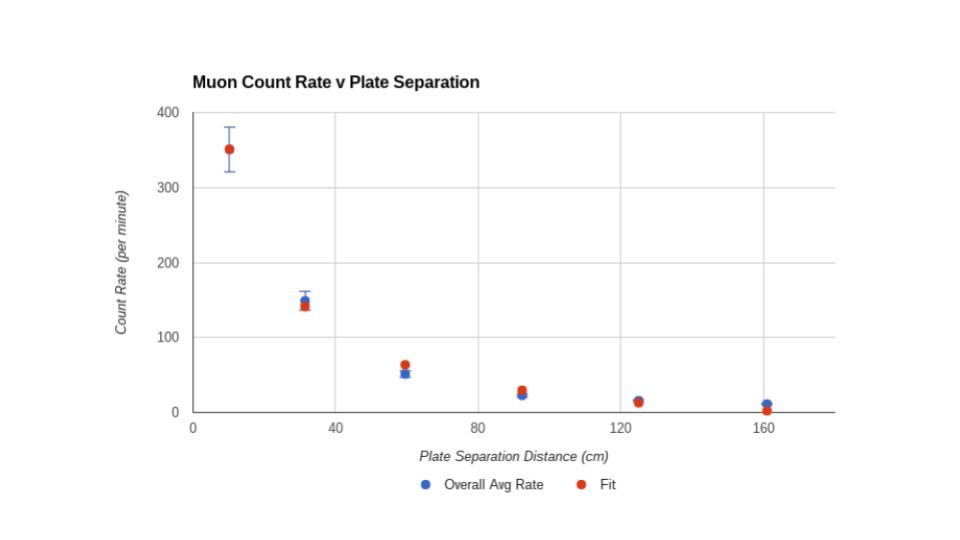
Figure 4. Graph with Fit (Rate = -24578/d^2 + 6362/d - 36.4; R^2 = 0.9961
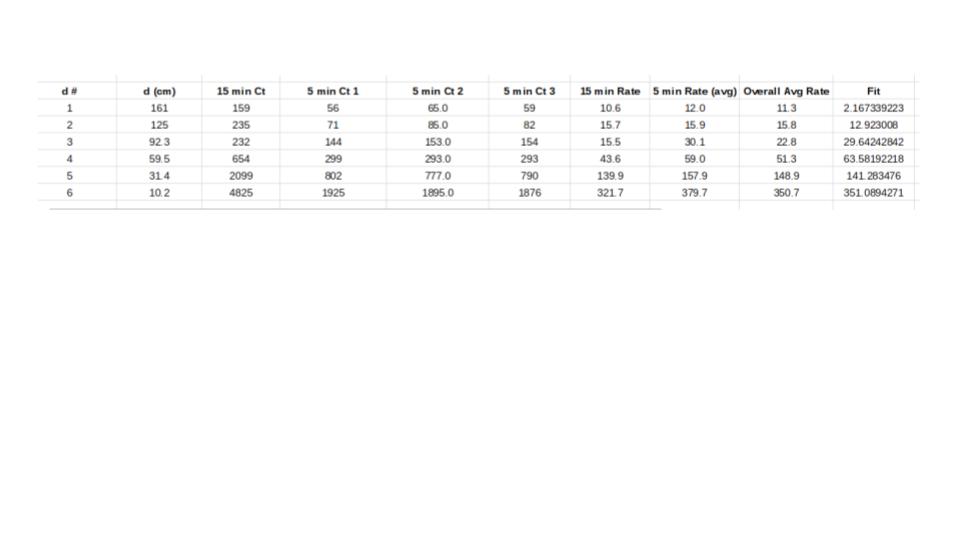
Figure 5. Data for Graph in Figure 4

Discussion and Conclusions
The quadradic regression equation (best fit) demonstrates that the count rate is inversely proportional to the square of the distance. ĀThe correlation coefficient (0.9961) value is further evidence that the relationship holds. ĀAs we increase the surface area of acceptance, by reducing the plate separation distance, the number of muons coincident on all four plates increases as predicted by the regression equation.
Bibliography
None required.