Smoky Mountain Cosmic Ray Flux Altitude Study
07/30/2013
Abstract
A flux study measures the rate of cosmic rays over a specific area. Cosmic rays interact via various particle physics processes and should show a variation with altitude. Four QuarkNet cosmic ray detectors were taken to the Smokey Mountains to run a flux study at various altitudes. The majority of the altitude experiment stops were along the main road to Newfound Gap and Clingman's Dome. The experiment would attempt to repeat the 2001 experiment at Snowmass conducted by several QuarkNet teachers (http://cosmic.lbl.gov/SnowMass/main.html). The snowmass experiment showed an increase in cosmic ray flux with altitude which means the secondary particles electromagnetic cascade effect varies. This experiment was also conducted by a group from Idaho state and students from Saranac Lake High school. Results from all of these experiments show an increase of cosmic ray flux with altitude. The effects is almost linear but fits an exponential curve for the small altitude changes measured involved in each study.
Introduction
When distant stars explode, charged particles are ejected into space. These nuclei (mostly protons) drift through the universe; some collide with Earth's atmosphere and become "cosmic rays." These collisions create showers of lower energy particles. Some you may know — protons, neutrons, smaller nuclei. Some are more exotic — pions, kaons, muons. Some of the exotic particles decay in the upper atmosphere; longer-lived particles reach Earth's surface. Each second, about 100 of these secondary cosmic rays pass through your body.
The particles that reach the earth are very easy to detect. One way is to use our setup of counters, photomiltiplier tubes (PMT) and a data acquisition card (DAQ). Together, these represent a simple system that records indirect evidence of cosmic ray activity.
The DAQ records this evidence in local computer files; detector owners can upload these files to our server, and you can investigate the data. The raw data, analysis tools and other features are collectively known as the Cosmic Ray e-Lab( https://www.i2u2.org/elab/cosmic/home/).
Cancer is the principal health effect that has been associated with low-dose radiation. As cosmic radiation is a very low-level source of radiation, the associated risk of developing cancer is also likely to be very low and difficult to establish with the scientific tools at hand.
There is little evidence so far that occupational exposure to cosmic radiation increases cancerrisk, and only limited evidence that increasing amounts of CR exposure may cause a corresponding increase in certain cancers. Several aircrew studies have shown an increased risk of melanoma and non-melanoma skin cancer.
The Earth's atmospheric layer provides significant shielding from cosmic radiation. At higher altitudes, this shielding effect decreases, leading to higher levels of cosmic radiation. The experiment gives an approximation of the increase in cosmic ray radiation received with altitude.
Procedures
The four detectors were set up at the first site for control purposes. Park Rangers had given us an option of several locations in the park to set up a control measurement of all detectors. Due to time constraints and the need to finish all measurement in one day,we decided to use the cabin altitude for convenience (640m). Data was obtained for one hour at each location. DAQ 6118 remained at the cabin while the other three detectors traveled to various altitude locations within the park system. Hence if Daq 6118 flux changed during the data period, we would expect a similar change not due to altitude to occur in the other detectors. After leaving the cabin, the detectors and laptops werepowered by a 12V 35 amphr marine battery. I would reccommend having a secondary battery because we did run the automobile battery at times just to be safe. Our first location was in the town of gatlinburg near the intersection of SR 73 and US 441. The remaining experimental sites were along US 441 up to Newfound gap and Clingman's Dome. It was very difficult to find locations along the road with a pulloff that allowed for enough GPS satelittes to be picked up and a significant difference in altitude from the previous position.
Results
Data for Daq other than 6420 were analyzed using elab flux study and rounded to the nearest hundred. Data for DAQ 6420(author's daq) was determined by taking total coincidences divided by total time.The control left at the cabin was the same before and after the experiment time (6600 events/min/m2). Unfortunately it must have lost power momentarily and reset the board( electrical and water works employees were in the area) within 15 minutes of our depature. So we will have to assume that the flux remained consistant throughout the day. The spreadsheet data in figure 1 is plotted in figure 2. A linear and exponential analysis was completed for daq 6420. This plot can be seen as figure 3.The linear plot shows a correlation of 0.99 even though it misses 5 of the 8 data point' error bars. An exponential fit is also shown and only misses 2 of the data points' error bars.
Figure 4 is a plot which adds data taken by teachers at Idaho State workshop in June of 2010 and students from Saranac Lake HS in May of 2010. A general trend exists between all the data in that as the altitude rises, so does the cosmic ray flux. it would be impracticle to do any correlations between the data because of difference in date, location, and equipment calibration.
The data also follows the general theory for cosmic ray flux with altitude. Figure 5 shows the general pfotzer curve and figure 6 shows the palmer model and data taken from West Virginia University High Altitude Cosmic Radiation (HACR) Detector Payload Summary and Flight Science Report. Figure 7 shows data taken using the Berkely cosmic ray detector by QuarkNet Teachers during 2001.
Figures
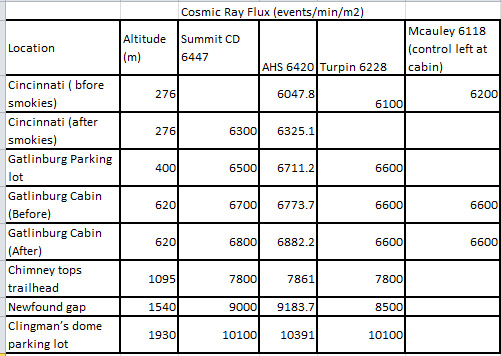
Figure 1. DAQ Spreadsheet data Cincy DAQS
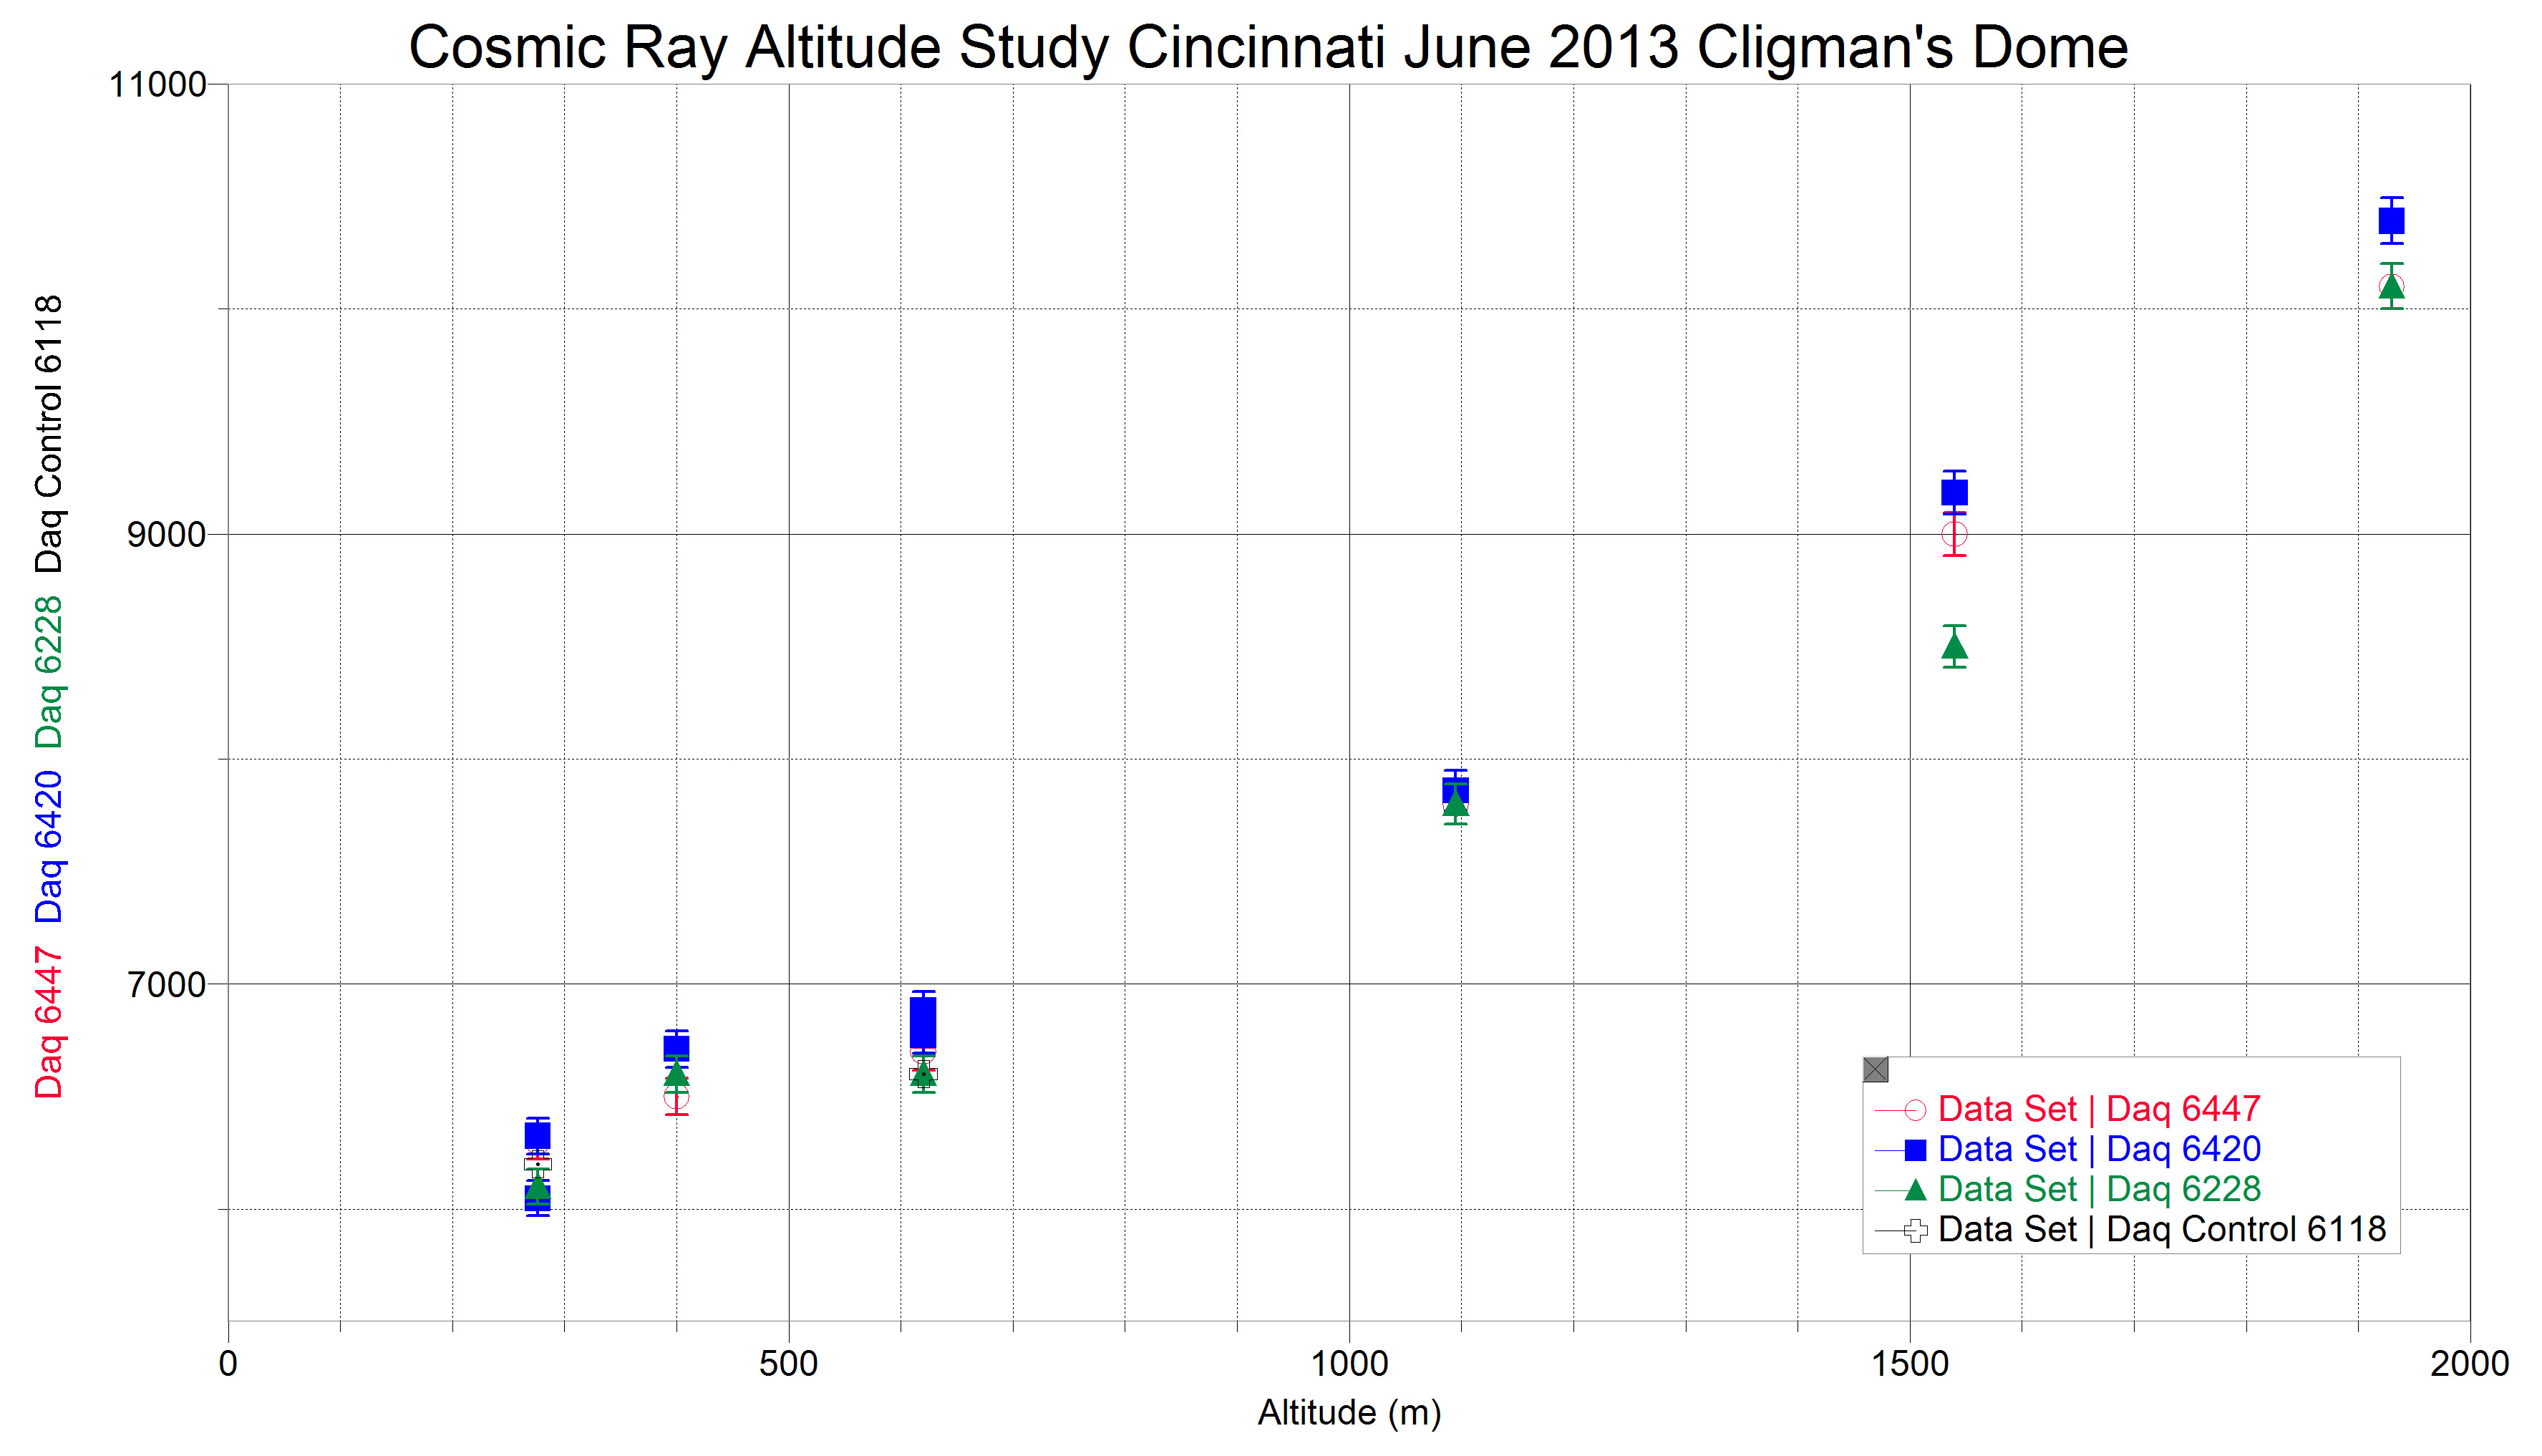
Figure 2. Plot Cincy DAQs Flux vs Altitude
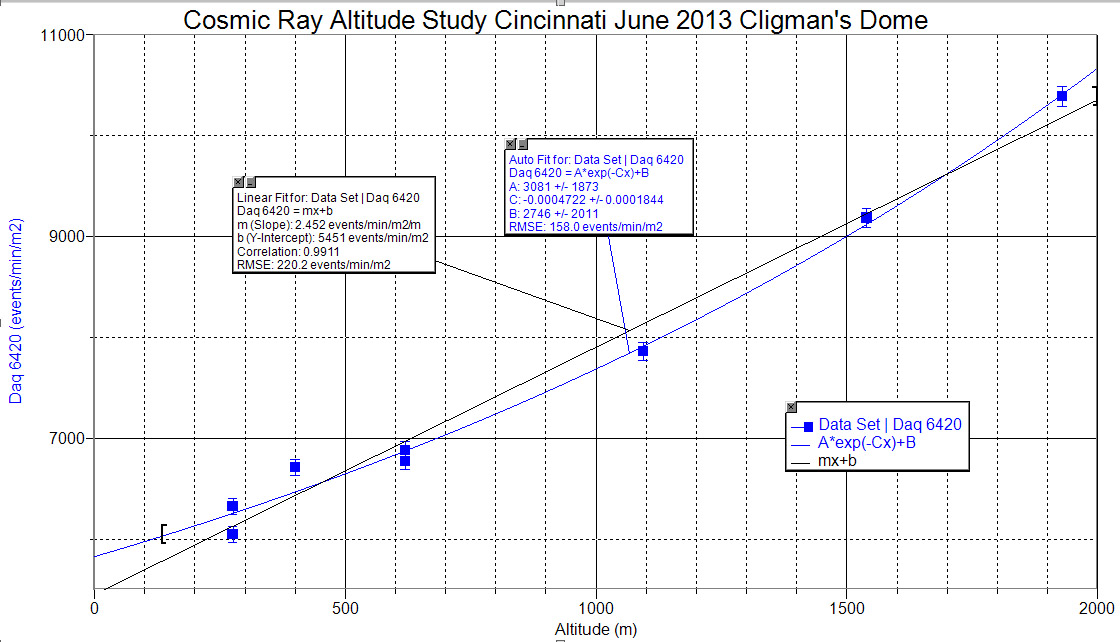
Figure 3. Daq 6420 Smokey Flux Study vs Altitude
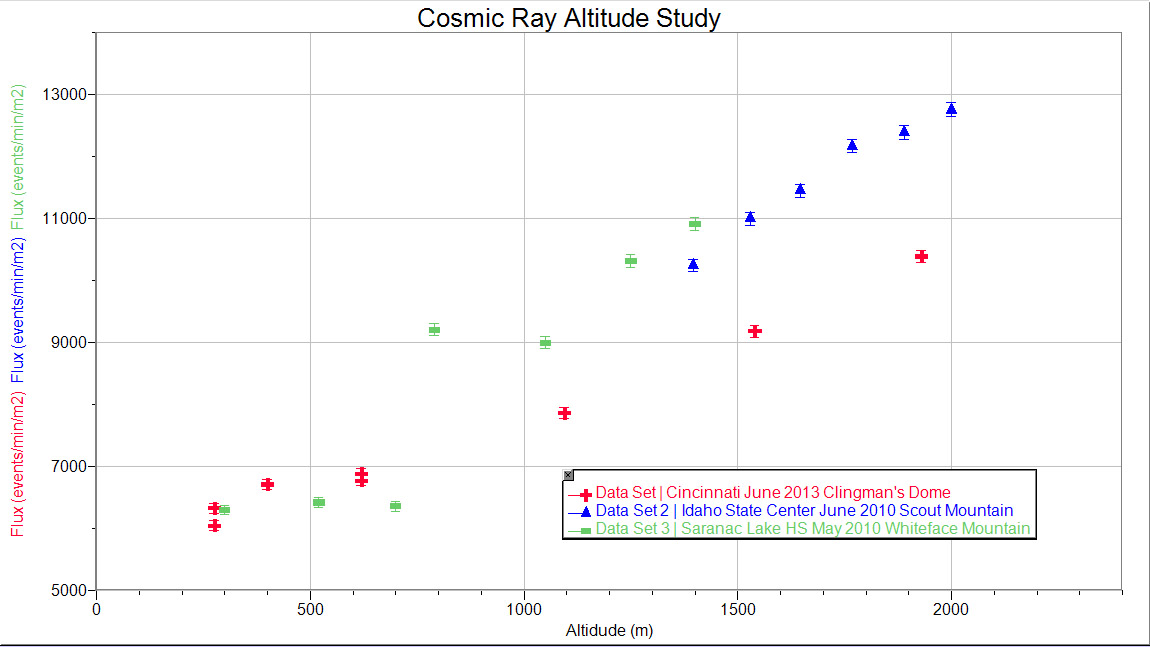
Figure 4. Combined Centers Cosmic Ray Flux vs Altitude Study
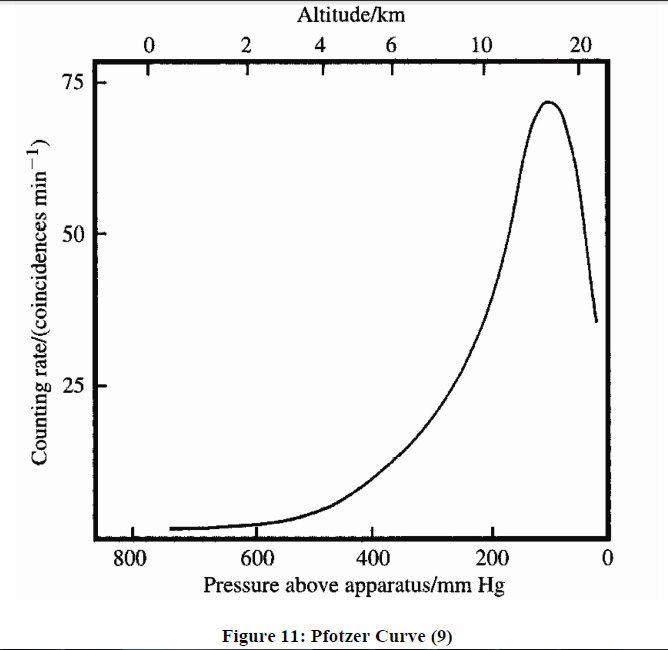
Figure 5. General Pfotzer curve ( flux vs altitude)
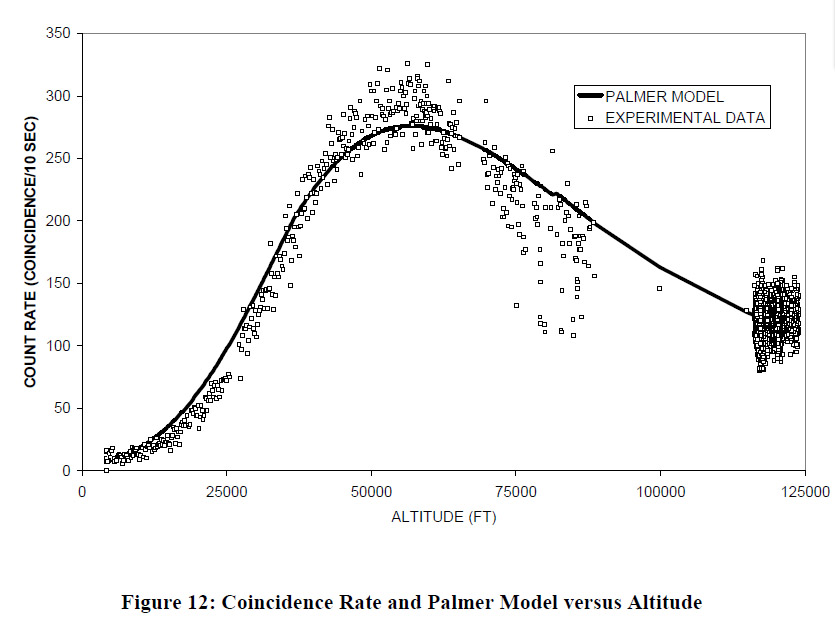
Figure 6. West Virginia Exeriment
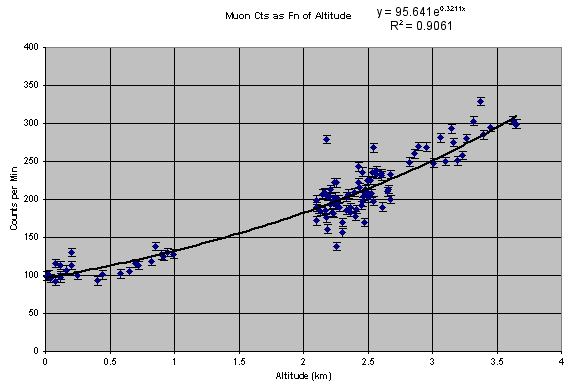
Figure 7. 2001 Snowmass plot Flux vs altitude

Discussion and Conclusions
Cosmic Ray flux increases with altitude and can be measured quantitatively with the QuarkNet Cosmic Ray detectors. Comparision with other experiments show similar trends for the altitude range. The next proposed experiment is to arrange a balloon flight for high altitude or a trip down a mine shaft or cave to measure the effect of the earth on flux. Also, a study for absorption that each floor in a tall build causes would be another valuable study
Bibliography
Cosmic ray e-lab https://www.i2u2.org/elab/cosmic/home/
Snowmass 2001 Quarknet Teachers take the Berkeley Detector to Colorado and Virginia http://cosmic.lbl.gov/SnowMass/main.html
Cosmic ray elab Poster Cosmic ray flux vs Altitude Idaho state University June 2010 and Saranac Lake HS May 2010
West Virginia University High Altitude Cosmic Radiation (HACR) Detector Payload Summary and Flight Science Report,Department of Mechanical and Aerospace Engineering,West Virginia University, Morgantown, WV 26506/6106,12/20/2007 Submitted by: WVU Team HACR Student Members: John H. Brewer, III,Nicholas J. Hansford, Jeremy C. Hill Faculty Members: Dr. G. Michael Palmer, Dr. John M. Kuhlman
World Health Organization. “Cosmic Radiation and Air Travel”. Nov. 2005 http://www.who.int/ionizing_radiation/env/cosmic/WHO_Info_Sheet_Cosmic_Radiation.pdf